This is the 12th straight year we’ve tried to pinpoint the communities that are thriving across the province. What began as B.C.’s Best Cities for Work, focused on job markets, has broadened into a statistics-based survey attempting to identify the strongest local economies according to a variety of data points.
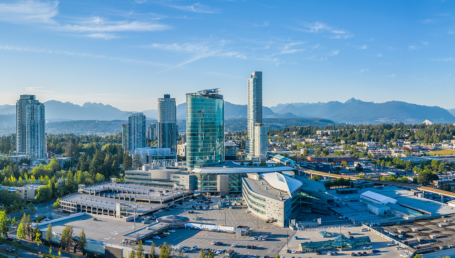
Our 2026 survey could be the most revealing yet. It shows that no one community has all its ducks in a row. The Township of Langley, our top-ranking municipality, earned 61.29 points out of a possible 90. While it exemplified economic diversification, rental market balance, strong population growth and resident sense of belonging, it scored slightly below average in household financial security and home sales activity. By the same token, the Victoria suburb of Colwood scored a perfect 10 out of 10 in two categories but lagged in others, dragging it down to tie for the No. 6 spot overall.
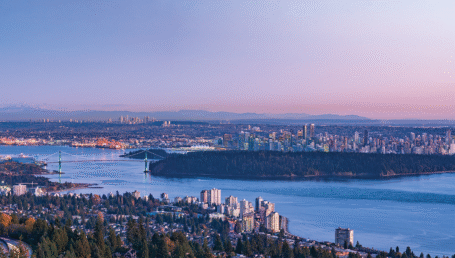
One trend clearly evident in this year’s numbers is that southern Vancouver Island is loosening its grip on many of the top spots. In the years immediately following the COVID-19 pandemic, an influx of remote workers and strong public-sector job growth made the Capital Region, especially, hard to beat. But our 2026 numbers show the job and real estate markets in Metro Vancouver and the Southern Interior to be rebounding somewhat, making them more competitive in our ranking.
Nos. 1–25
| 2026 Rank | 2025 Rank | City | 2025 Total Population | Population Change 2020–25 (%) | Employment Chg. Oct ’24–Oct ’25 (%) | Unemployment Rate Oct ’25 | Housing Starts /10K | Residential Sales /10K | Rental Vacancy Rate (%) | Financial Vulnerability Index | Resident Sense of Belonging | Economic Diversity (HHI Score) |
|---|---|---|---|---|---|---|---|---|---|---|---|---|
| 1 | 15 | Langley (DM) | 162,612 | 20 | 1.3 | 6.3 | 98.6 | 85.7 | 3.4 | 102 | 215 | 728 |
| 2 | 2 | Langford (CY) | 61,040 | 32 | -0.4 | 4.2 | 207.9 | 97.9 | 4.3 | 110 | 185 | 889 |
| 3 | NR | North Saanich (DM) | 13,707 | 12 | -0.4 | 4.2 | 9.5 | 75.9 | 2.4 | 73 | 199 | 761 |
| 4 | NR | White Rock (CY) | 24,782 | 11 | 1.3 | 6.3 | 65.7 | 83.9 | 1.8 | 85 | 212 | 751 |
| 5 | 1 | Sidney (T) | 13,513 | 8 | -0.4 | 4.2 | 20 | 138.5 | 2.4 | 75 | 183 | 888 |
| 6 (tie) | 32 | Summerland (DM) | 12,743 | 4 | 6.5 | 7.3 | 145.7 | 114.2 | 1.8 | 84 | 178 | 780 |
| 6 (tie) | NR | Colwood (CY) | 22,458 | 16 | -0.4 | 4.2 | 256 | 87.1 | 4.3 | 97 | 190 | 1,005 |
| 8 | 24 | Coquitlam (CY) | 173,889 | 13 | 1.3 | 6.3 | 103.7 | 57.7 | 1.5 | 101 | 221 | 755 |
| 9 | 42 | Port Coquitlam (CY) | 68,097 | 6 | 1.3 | 6.3 | 143.2 | 51.5 | 3.8 | 103 | 211 | 743 |
| 10 | 4 | Kelowna (CY) | 170,324 | 15 | 15.9 | 9.3 | 109.9 | 95.6 | 3.7 | 96 | 181 | 815 |
| 11 | 8 | Victoria (CY) | 107,540 | 12 | -0.4 | 4.2 | 86.4 | 73.1 | 2.5 | 93 | 191 | 901 |
| 12 | NR | Lake Country (DM) | 18,539 | 16 | 15.9 | 9.3 | 35.7 | 95.7 | 3.7 | 88 | 189 | 766 |
| 13 | 27 | Burnaby (CY) | 297,912 | 15 | 1.3 | 6.3 | 90.3 | 51.5 | 1.5 | 99 | 217 | 752 |
| 14 | NR | Port Moody (CY) | 39,372 | 13 | 1.3 | 6.3 | 7.1 | 79.7 | 1.5 | 88 | 220 | 756 |
| 15 | 23 | North Vancouver (CY) | 67,279 | 13 | 1.3 | 6.3 | 30.5 | 63.6 | 1.5 | 90 | 223 | 793 |
| 16 | 34 | Langley City (CY) | 35,531 | 20 | 1.3 | 6.3 | 97.5 | 74.6 | 1.8 | 117 | 197 | 782 |
| 17 | 12 | Sooke (DM) | 17,625 | 16 | -0.4 | 4.2 | 98.9 | 92 | 4.3 | 112 | 184 | 878 |
| 18 | 16 | North Vancouver (DM) | 99,588 | 9 | 1.3 | 6.3 | 12.4 | 63.2 | 2.9 | 88 | 208 | 804 |
| 19 | 18 | Squamish (DM) | 26,533 | 12 | 0.5 | 6.6 | 75.8 | 115.5 | 0.7 | 90 | 196 | 812 |
| 20 | 3 | Central Saanich (DM) | 18,632 | 4 | -0.4 | 4.2 | 18.8 | 88.7 | 3.5 | 83 | 184 | 814 |
| 21 | 30 | New Westminster (CY) | 92,115 | 12 | 1.3 | 6.3 | 62.2 | 52.6 | 1.4 | 101 | 209 | 745 |
| 22 | 5 | West Kelowna (CY) | 41,974 | 14 | 15.9 | 9.3 | 16.9 | 93.3 | 3.7 | 96 | 185 | 796 |
| 23 | 29 | Vancouver (CY) | 769,947 | 10 | 1.3 | 6.3 | 67.5 | 44.8 | 1.5 | 90 | 208 | 800 |
| 24 | 7 | Parksville (CY) | 14,890 | 9 | 1.4 | 5.3 | 15.4 | 142.3 | 2.1 | 90 | 176 | 984 |
| 25 | 17 | Campbell River (CY) | 39,495 | 9 | 1.4 | 5.3 | 45.3 | 102.5 | 1.8 | 97 | 180 | 847 |
| 26 | NR | Oak Bay (DM) | 19,073 | 3 | -0.4 | 4.2 | 28.9 | 80 | 1.5 | 74 | 194 | 933 |
| 27 | 39 | Surrey (CY) | 688,505 | 17 | 1.3 | 6.3 | 62 | 45.6 | 1.7 | 115 | 206 | 770 |
| 28 | 35 | Maple Ridge (CY) | 105,420 | 13 | 1.3 | 6.3 | 52.1 | 78.2 | 0.9 | 108 | 205 | 767 |
| 29 | 37 | Delta (CY) | 123,437 | 10 | 1.3 | 6.3 | 84.2 | 47.9 | 0.7 | 96 | 204 | 742 |
| 30 | 38 | Richmond (CY) | 244,358 | 12 | 1.3 | 6.3 | 23.4 | 57 | 0.9 | 103 | 219 | 755 |
| 31 | 13 | Duncan (CY) + North Cowichan (DM) | 40,072 | 6 | 1.4 | 5.3 | 23 | 95 | 2.2 | 100 | 186 | 848 |
| 32 | 14 | Comox (T) | 15,934 | 5 | 1.4 | 5.3 | 22 | 101.9 | 1.7 | 83 | 182 | 904 |
| 33 | 26 | Salmon Arm (CY) | 20,939 | 7 | 6.5 | 7.3 | 32.5 | 112.9 | 0.8 | 89 | 184 | 801 |
| 34 | NR | West Vancouver (DM) | 48,031 | 6 | 1.3 | 6.3 | 10.6 | 65.2 | 4.1 | 102 | 220 | 860 |
| 35 | 22 | Penticton (CY) | 39,296 | 4 | 6.5 | 7.3 | 66.4 | 111.7 | 1.2 | 93 | 183 | 896 |
| 36 | 11 | Courtenay (CY) | 32,763 | 13 | 1.4 | 5.3 | 14.1 | 115.6 | 5.1 | 95 | 177 | 895 |
| 37 | 6 | Saanich (DM) | 127,149 | 4 | -0.4 | 4.2 | 46.2 | 63.9 | 1.4 | 86 | 186 | 884 |
| 38 | 9 | Sechelt (DM) | 11,113 | 0 | 1.3 | 6.3 | 53.2 | 106.3 | 1.2 | 90 | 179 | 759 |
| 39 | NR | Coldstream (DM) | 11,625 | 2 | 6.5 | 7.3 | 31.9 | 79.3 | 1.1 | 85 | 193 | 774 |
| 40 | 10 | Nanaimo (CY) | 112,672 | 10 | 4.9 | 8.2 | 28.4 | 83.6 | 2.9 | 105 | 184 | 859 |
| 41 | 36 | Pitt Meadows (CY) | 21,584 | 9 | 1.3 | 6.3 | 0.5 | 57.9 | 0.9 | 97 | 205 | 722 |
| 42 | 45 | Cranbrook (CY) | 22,792 | 7 | 2.2 | 6.3 | 51.3 | 95.2 | 1.4 | 102 | 178 | 847 |
| 43 | 19 | Vernon (CY) | 49,767 | 10 | 6.5 | 7.3 | 26.7 | 106.2 | 1.1 | 96 | 178 | 878 |
| 44 | NR | View Royal (T) | 13,070 | 10 | -0.4 | 4.2 | 2.3 | 73.8 | 3.9 | 93 | 173 | 970 |
| 45 | 33 | Chilliwack (CY) | 105,276 | 10 | 0.5 | 7.1 | 40 | 90.7 | 1.3 | 110 | 185 | 792 |
| 46 | 21 | Powell River (CY) | 15,139 | 6 | 1.4 | 5.3 | 52.3 | 92.1 | 1.2 | 103 | 177 | 918 |
| 47 | NR | Esquimalt (CY) | 19,346 | 5 | -0.4 | 4.2 | 105.7 | 50.3 | 1.5 | 101 | 175 | 1,018 |
| 48 | 20 | Abbotsford (CY) | 173,194 | 9 | -2.4 | 7.2 | 77.2 | 57.2 | 1.3 | 112 | 191 | 771 |
| 49 | 31 | Mission (DM) | 47,169 | 10 | -2.4 | 7.2 | 100.6 | 62.3 | 1.5 | 117 | 184 | 819 |
| 50 | 25 | Kamloops (CY) | 109,686 | 8 | 12.3 | 9.6 | 29.3 | 80.3 | 1.4 | 101 | 183 | 822 |
CY=City; T=Town; DM=District Municipality; RM=Resort Municipality.
Standouts by category
Nonetheless, population growth and per capita housing starts in Langford are still off the charts. (Literally, in the case of new housing; we had to fudge the weighting, bell curve-style, lest other cities’ construction rates be dismissed.) North Saanich boasts the lowest rate of household financial vulnerability. Farther up the Island, Parksville has the province’s busiest residential real estate market on a per-capita basis.
Surveys by our research partner Environics Analytics showed that residents of the City of North Vancouver enjoy the strongest sense of belonging in their community. And, believe it or not, Pitt Meadows could be the place to be in the event of a recession—its residents work in the greatest variety of industries. If any one of those industries gets hit by tariffs or another shock, expect the lights to still be on.
Langley Township’s rise to #1 from #15 is impressive, but there were bigger gainers over the past year. Port Coquitlam climbed 33 positions to #9; Summerland rose 26 to tie for #6. The big losers over the past year were Saanich (-31), Nanaimo (-30) and Sechelt (-29).
We also welcomed 10 mostly bedroom municipalities to the 2026 list that hadn’t been ranked in the past due to their small job markets. But if COVID taught us anything, it’s that people carry out their jobs virtually everywhere. And adding in the likes of North Saanich, White Rock and West Vancouver makes our list more competitive. As a result, several ranked cities from past years—most notably Prince George—did not make the Top 50 cut for 2026 out of 59 eligible municipalities.
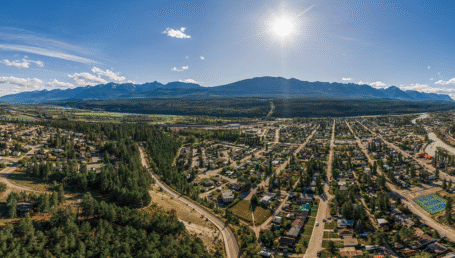
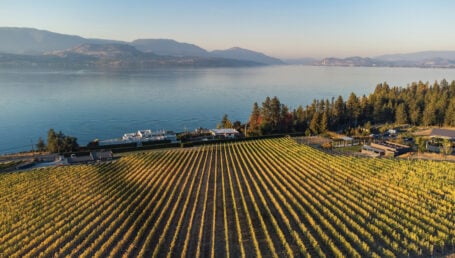
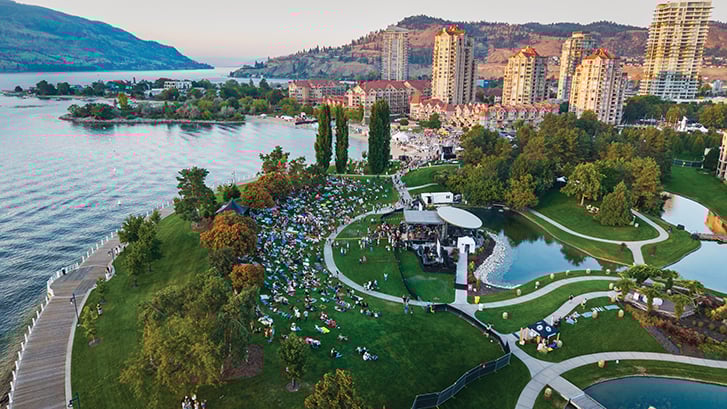
The lure of the Okanagan
Jason Richards, the founder and CEO of Minga, a Kelowna-based developer of student behaviour and engagement software for K-12 schools, belongs to an informal “surf club” made up of fellow entrepreneurs. Every Friday during the warm months, members hit the water of Okanagan Lake at 6 a.m. for a casual wake surfing session. They are in their respective offices by 9 a.m.

Kelowna may not have the critical mass in technology of Toronto or Vancouver or even Kitchener–Waterloo, but it still “punches way above its weight class” in the industry, says Richards, whose company ranked #4 in Canada in the Companies to Watch category in Deloitte’s 2025 Technology Fast 50 program. And, being a smaller city, businesspeople here have tighter relationships with each other than you might find in a big urban centre.
“Kelowna’s a really fascinating environment. A lot of people move to Kelowna and their first reason is lifestyle,” Richards says. Recruiting top tech talent, both within and outside the community, is easier than you might expect, he adds—important considering Minga doubled its head count to 90 in 2025. “When you have these lifestyle anchors that you build your company and your community with, it creates so much more of a powerful connection between people.”
What’s kept Kelowna and its neighbour municipalities of the Central Okanagan consistently contending for the ranks of the top 10 Most Resilient Cities over the past few years—it came in at #10 for 2026, while Lake Country landed at #12 and Summerland tied for that 6th—is an impressive record of job creation. As our data shows, the pattern persisted this year; the region recorded a 15.9-percent rise in the number of employed residents between October 2024 and the same month in 2025. (Compare that with the Capital Region around Victoria, which actually lost jobs over the same period, despite scoring well in a number of other criteria.)

Shane Bishop can’t imagine a better place from which to launch and grow his tech-enabled medication delivery and clinical services company, Custom Health, which now has pharmacy operations and institutional customers across North America. Kelowna boasts a significant population of angel investors that helped finance his initial company’s early years, Bishop says, and having the 10th busiest airport in Canada makes connecting face-to-face with investors, customers and 230 far-flung employees relatively painless. UBC Okanagan and Okanagan College, meanwhile, help provide a stream of trained pharmacy technicians and other head-office staff.
“We were able to build a team quite quickly and to innovate,” says Bishop, a pharmacist who founded Catalyst Healthcare in 2012, which eventually merged into Custom Health. (The company is now preparing to go public on the Toronto Stock Exchange.) “It’s been a really good place to do business in our space.”
Just so you know:
- Although we use the term “city” throughout, our annual survey is technically a ranking of municipalities, as legally defined by the B.C. Local Government Act.
- Our sample is limited to municipalities of 10,000 or more permanent residents. The City of Quesnel, which appeared in past years, dipped below that population threshold in 2025 and was, as a result, not included in the survey.
- Langley and North Vancouver are represented on the ranking by both their city and district municipalities. Data for Duncan and North Cowichan were combined as a single urban area.
- We work with research partner Environics Analytics because we believe it has the best data available—but even the best data has its limitations. To produce municipal-level population growth numbers, for example, Environics Analytics used regional-level estimates from Statistics Canada to make 2025 projections.
- Job numbers and unemployment rates come from StatCan’s monthly Labour Force Survey and only present figures for B.C.’s eight economic regions and four largest census metropolitan areas for the first three quarters of 2025. Similarly, monthly housing starts figures provided by Canada Mortgage and Housing Corp. (CMHC) and quarterly residential sales figures from BC Assessment only reflect the year-to-date figures collected to the end of September. As such, those indicators won’t account for economic trends evident from October 2025 onward.
- Annual rental vacancy rates provided by CMHC represent the “primary rental market” or private apartment unit market only. However, the primary rental market rates for several cities on our list were not reported due to unreliable or insufficient data. In these cases, we used data from larger neighbouring municipalities as a proxy.
How we crunched the numbers
In our quest to identify British Columbia’s most economically resilient cities, we analyzed nine key metrics for 59 municipalities with populations of 10,000 or more. Data for each criterion was converted into a proportionate score out of 10. Adding up the individual scores, we assigned each municipality a total score out of 90 points on which we based our rankings.
The criteria:
Five-year population growth (maximum score of 10 points)
This figure represents the population growth for each city from 2020 to 2025, according to Environics Analytics. We gave the highest- growth city 10 points and scored the others in proportion to that.
Household financial vulnerability (10 points)
This figure—an index created by Environics Analytics—looks at a range of household financial variables, including debt, liquid assets and discretionary income, to show how precarious a typical household’s finances are in a given city. The higher the index value, the more vulnerable a city’s households are on average. Therefore, we gave the lowest value 10 points and scored the others in relation to that.
Resident sense of belonging (10 points)
This value represents the sense of belonging that a resident has within their community, as derived from Environics Analytics’ Community Life Survey. We combined index scores (where the Canadian average=100) of residents reporting a “very strong” or “somewhat strong” sense of belonging and assigned the municipality with the highest total a score of 10, with all other values ranked in relation to that.
Rental vacancy rate (10 points)
This indicator reflects the reported vacancy rate for rental housing units from Canada Mortgage and Housing Corp.’s annual Rental Market Survey. The highest scores were awarded to municipalities with vacancy rates closest to 3 percent, considered a balanced market. Cities with vacancy rates significantly lower or higher than 3 percent scored proportionately less.
Residential sales per 10,000 residents (10 points)
This number, derived from quarterly BC Assessment data, reflects the year-to-date sales totals for single-family and strata residential properties to the end of September 2025. After dividing sales totals by total city population, we multiplied that figure by 10,000 to determine the number of sales per 10,000 residents. We gave the highest value 10 points and scored the others accordingly.
Housing starts per 10,000 residents (10 points)
We derived this value from the year-to-date housing starts from CMHC’s monthly Starts and Completions Survey to the end of September 2025. The city with the highest number of housing starts per 10,000 residents received a score of 10, with the other cities scoring in relation to that.
Change in number of jobs (10 points)
This figure measures the change in the employed labour force from October 2024 to October 2025, derived from Statistics Canada’s monthly Labour Force Survey. The municipality showing the greatest percentage job increase was assigned a score of 10 and the rest ranked in relation to that.
Unemployment rate (10 points)
For this indicator, we took unemployment rates for each city from October 2025 as reported in StatCan’s monthly Labour Force Survey. We gave the city with the lowest rate 10 points and evaluated the others in relation to that.
Economic diversity (10 points)
This value is derived by applying the Herfindahl–Hirschman Index—a formula used to measure market and industrial concentration—to StatCan employment data to determine the diversity of a city’s employment base by 19 sectors. The closer this number is to 10,000 the less diverse a city’s workforce is while a number closer to 0 represents a more diverse workforce. Therefore, we gave the lowest value 10 points and scored the others in relation to that.